


Point Chart
Point Chart displays series as a sets of points along the axes X and Y, where X and Y can represent any data type. Defined values are the location of points in the diagram plane (see Figure 1).
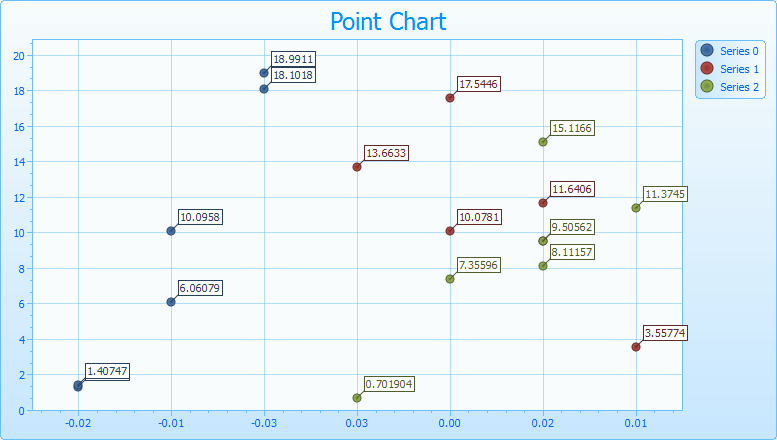
Figure 1 Point Chart Screenshot
By default the points are displayed as dots. If a Point Chart to display multiple rows are then markers of different shapes and sizes are used. Point Chart are commonly used to compare the aggregate values of different categories.
Line Chart
Line Chart display values as a series of points connected by a single line. This type of chart is used to represent large amounts of data distributed over a continuous period that is most optimal to illustrate trends in data changing over time (see Figure 2).
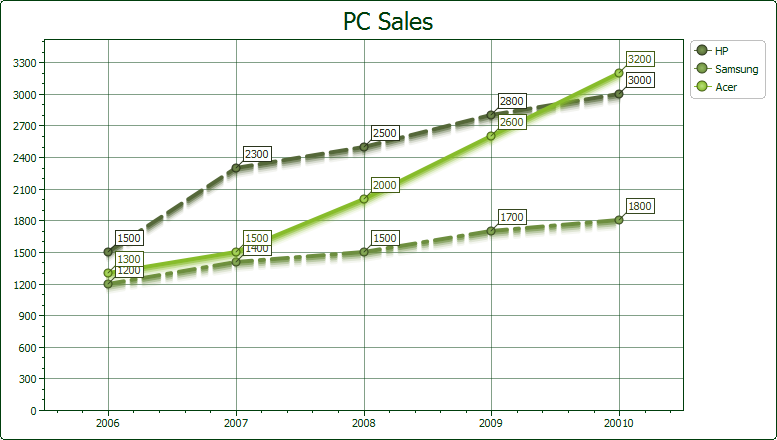
Figure 2 - Line Chart Screenshot
To enhance the visual impact of the diagram, you can increase the thickness of the line or change the shape and size of the markers. If data set is contain null values then the chart will automatically connect the points of the previous value and subsequent values in order to ensure the continuity of lines, which is associated with the displayed data. If the data set is contain only one data point then the chart will be displayed as a single marker.
Step Line Chart
Step Line Chart is a variation of the traditional Line Chart but instead of the usual lines is used the step lines. In Step Chart points are connected by a lines reminding the steps of the ladder (see Figure 3).
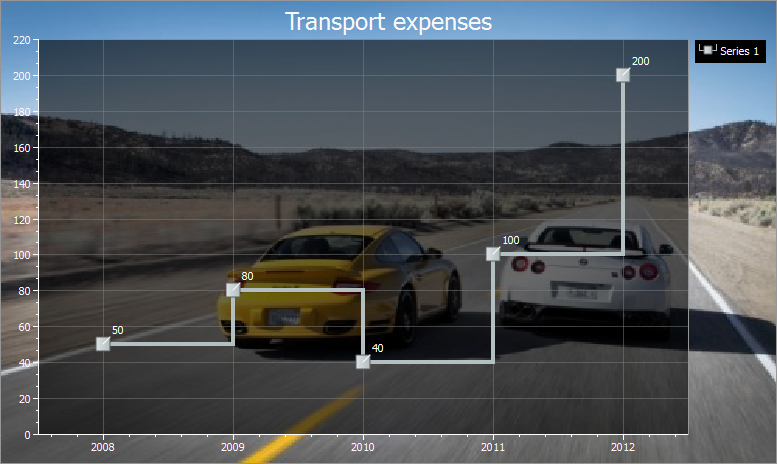
Figure 3 Step Line Chart Screenshot
Spline Chart
Spline Chart is a kind of Line Chart but a series of data points are connected the smooth curve of "spline" segments (see Figure 4).
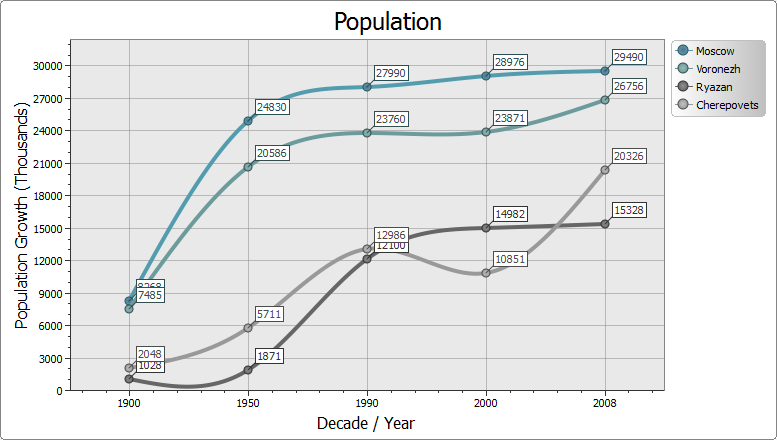
Figure 4 Spline Chart Screenshot in Black Theme
Bar Chart
Bar Chart is a histogram displays series of data as a set of vertical bars, grouped by category. Histograms are useful for showing data which are changes over time, and for visual comparison of the items. This type of charts can be used to display continuous data (see Figure 5), but more often are used for displaying discrete values (for instance color of the cars or the size of car's tires).
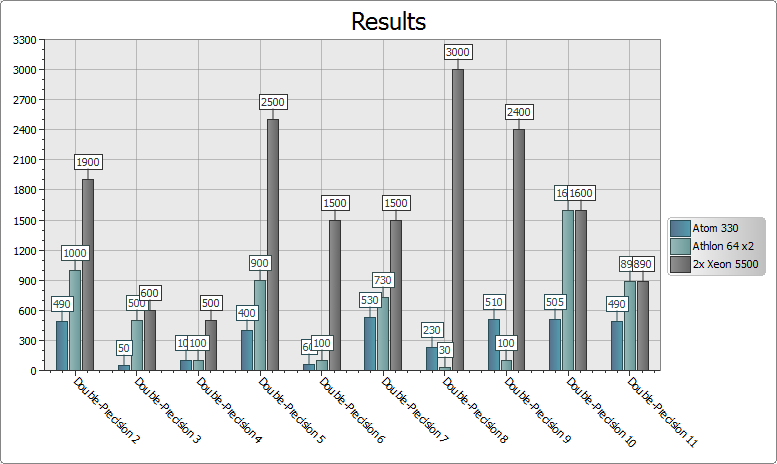
Figure 5 Bar Chart Screenshot
Stacked Bar Chart
This histogram is a variation of the standard Bar Chart and is used to compare the contribution of each value in the amount by category, expressing them in units or percentages. In addition, each bar is used to represent the total amount. For example, you can simply estimate the amount of certain types of expenditure on car maintenance or compare the contribution of each type of expenditure in the total amount (see Figure 6)
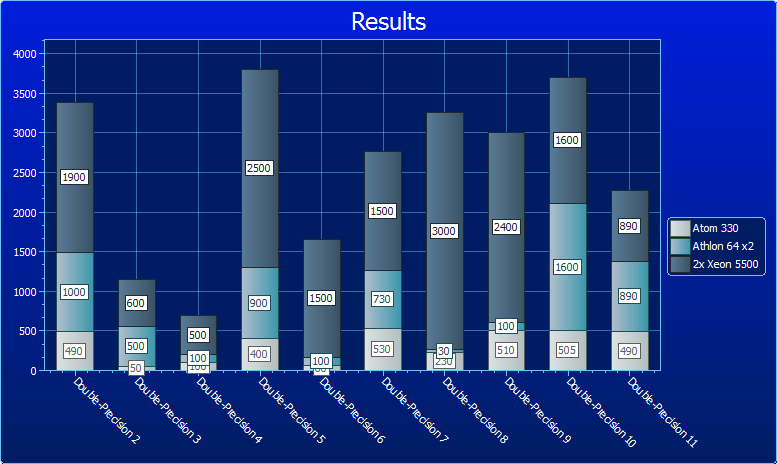
Figure 6 Stacked Bar Chart Screenshot
In this histogram is possible to set values as a percentage. In the screenshot bellow the total amount is represented in percentage (see Figure 7).
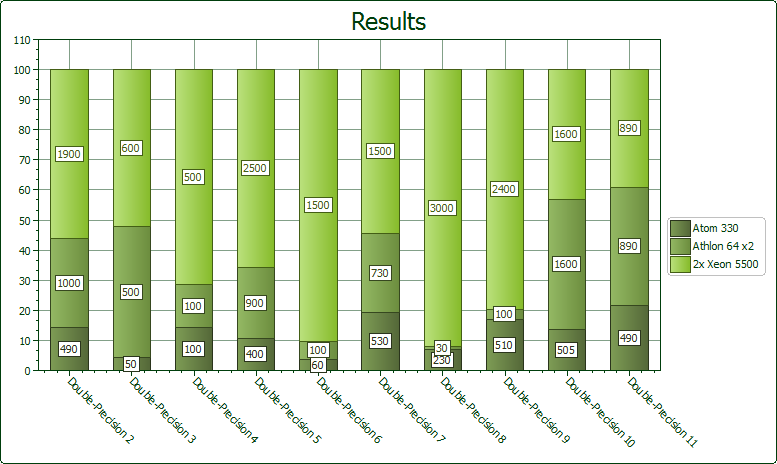
Figure 7 Stacked Bar Chart in percentage Screenshot
Side by Side Stacked Bar Chart
This kind of Bar Chart displays data as a series of vertical or horizontal stripes. This type of chart is best suited for display of multiple set of values for a certain period of time. For example, sales for projects in the regions for a number of vendors (see Figure 8).
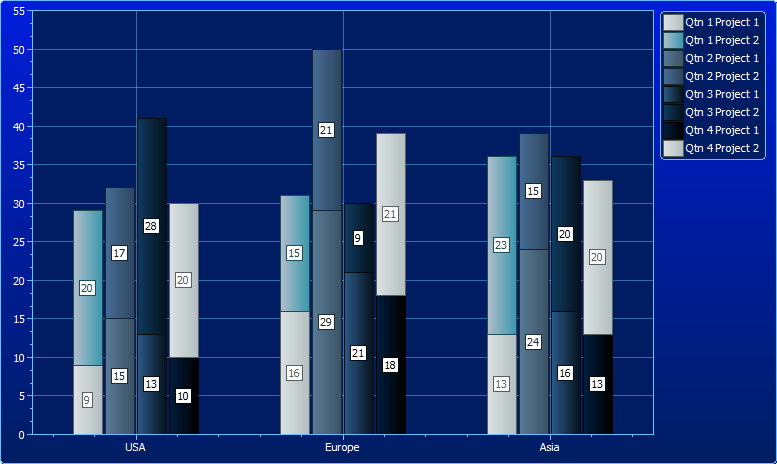
Figure 8 Side by Side Stacked Bar Chart Screenshot
Pie Chart
Pie Chart displays the data in the form of sectors of the proportional fraction of the whole. Pie charts are a group of charts that do not have axes and they are typically used to compare groups. The example shown in Figure 9 illustrates the percentage of website's traffic from different cities.
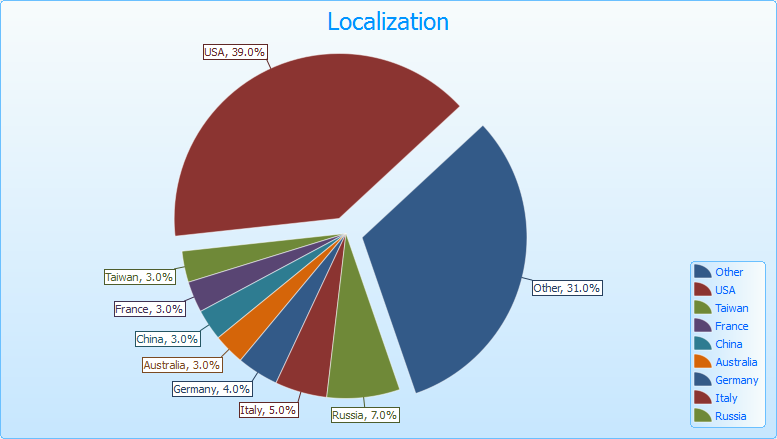
Figure 9 Pie Chart Screenshot in Black Theme
Doughnut Chart
Doughnut Chart displays the data in the form of sectors of the proportional fraction of the whole. Categories are represented by individual slices. The size of slice is determined by the percentage of the value of the series to the sum of all values. Doughnut charts are subdivided into simple circular and sliced circular. In simple circular diagram a group of categories, groups of series and series of values are displayed as a slices of the circular. In the sliced circular diagram, slices are shifted from the center of the circle which leads to gaps between the slices (see Figure 10).
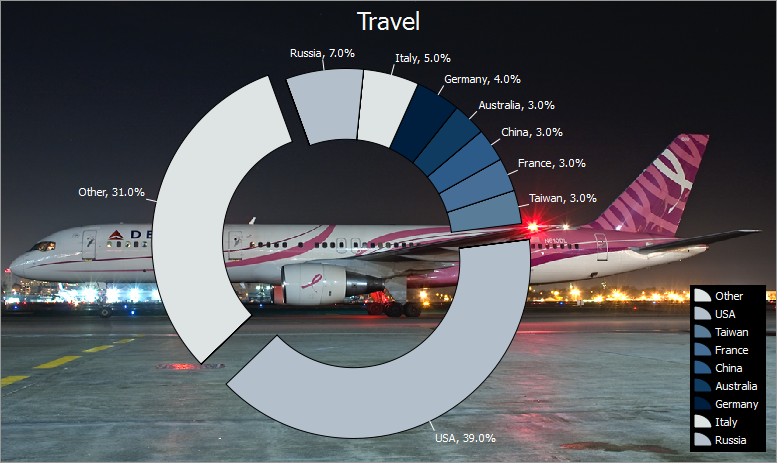
Figure 10 Doughnut Chart Screenshot in Black Theme
Area Chart
In Area Chart the data represented as filled area below of connected points. Line of connecting points is a smooth curve. Therefore, Area Charts are commonly used to represent data relating to a continuous period of time (see Figure 11).
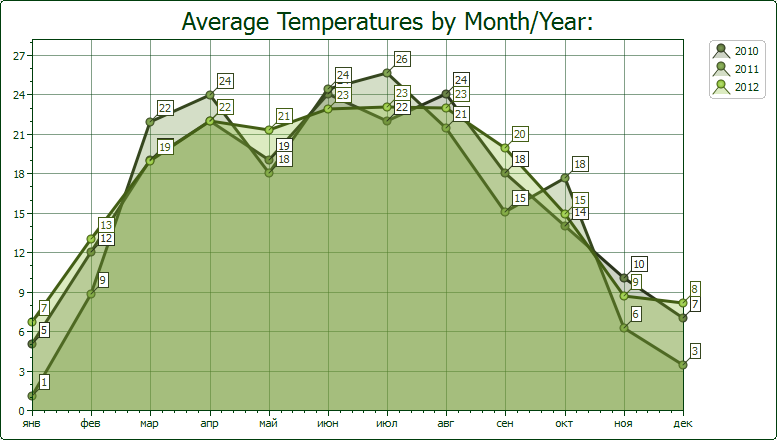
Figure 11 Area Chart Screenshot
Stacked Area Chart
Stacked Area Chart allows you to display results for all series, as well as a proportionate part of each series in the overall amount, because a few series are overlapping a vertically (see Figure 12).
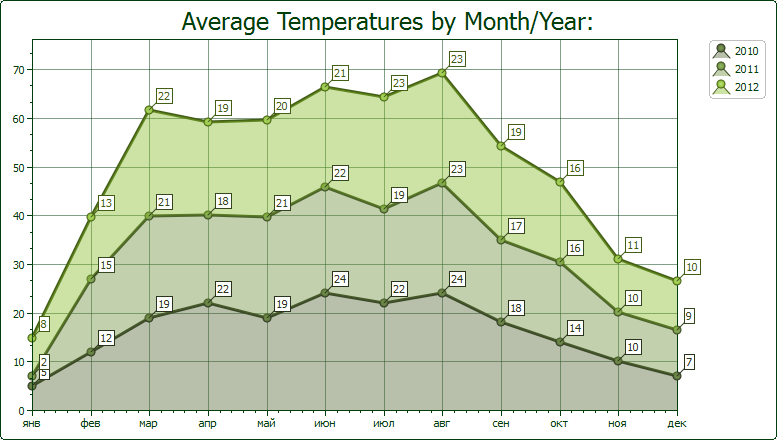
Figure 12 Stacked Area Chart Screenshot
In this chart is possible to set values as a percentage. Chart can be used to display the proportional data that changes over time (see Figure 13).
Figure 13 Stacked Area Chart Screenshot
Spline Area Chart
Spline Area Chart is a kind of area chart in which data points are connected by a spline, rather than a broken line. Spline Area Chart is used instead of the usual Area Chart if more important to show trends rather than provide the values of individual points (see Figure 14).
Figure 14 Spline Area Chart Screenshot
Stacked Spline Area Chart
Stacked Spline Area Chart allows you to display results for all series, as well as a proportionate part of each series in the overall amount. Data points are connected by a spline lines (see Figure 15).

Figure 15 Stacked Spline Area Chart Screenshot
In this chart is possible to set values as a percentage (see Figure 16).
Figure 16 Stacked Spline Area Chart in percentage Screenshot in Black Theme
Financial Chart
Open-High-Low-Close series to illustrate movements in the price of a financial instrument over time and Candle Stick to describe price movements of a security, derivative, or currency. (see Figure 17)
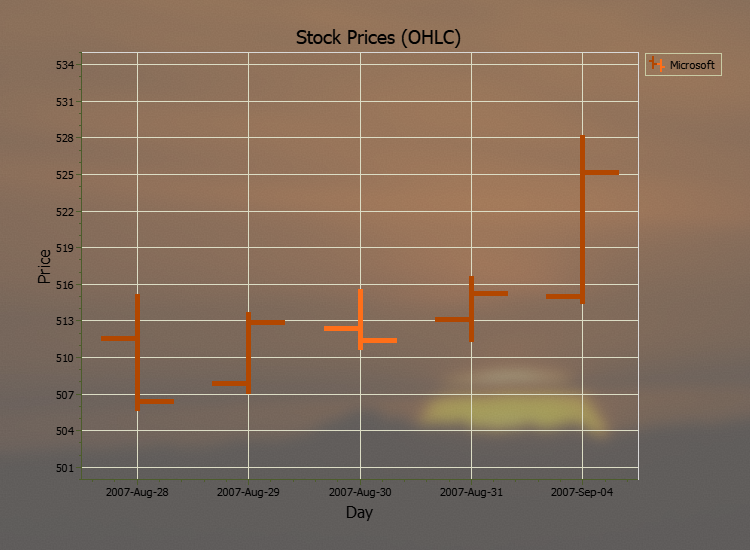
Figure 17 Open-High-Low-Close series screenshot with Acrylic material background.
Candle Stick to describe price movements of a security, derivative, or currency. (see Figure 18)
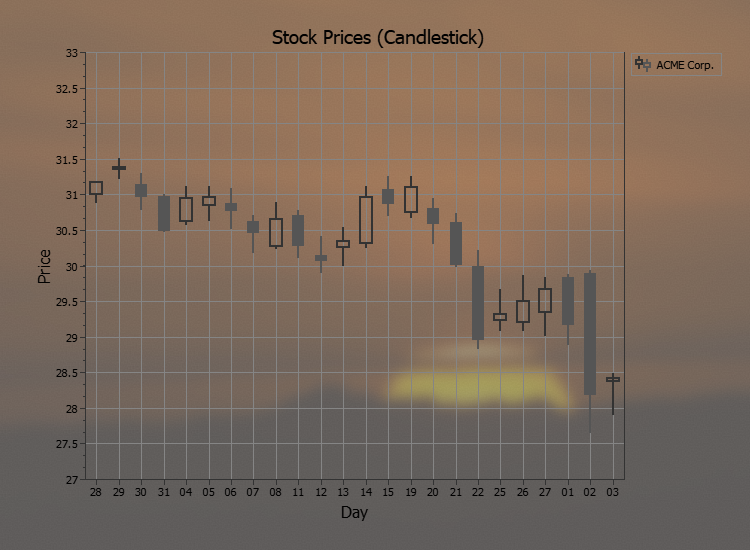
Figure 18 Candle Stick series screenshot with Acrylic material background.


